Source: TradingView, CNBC, Bloomberg, Messari
The Summer 2021 Analogy
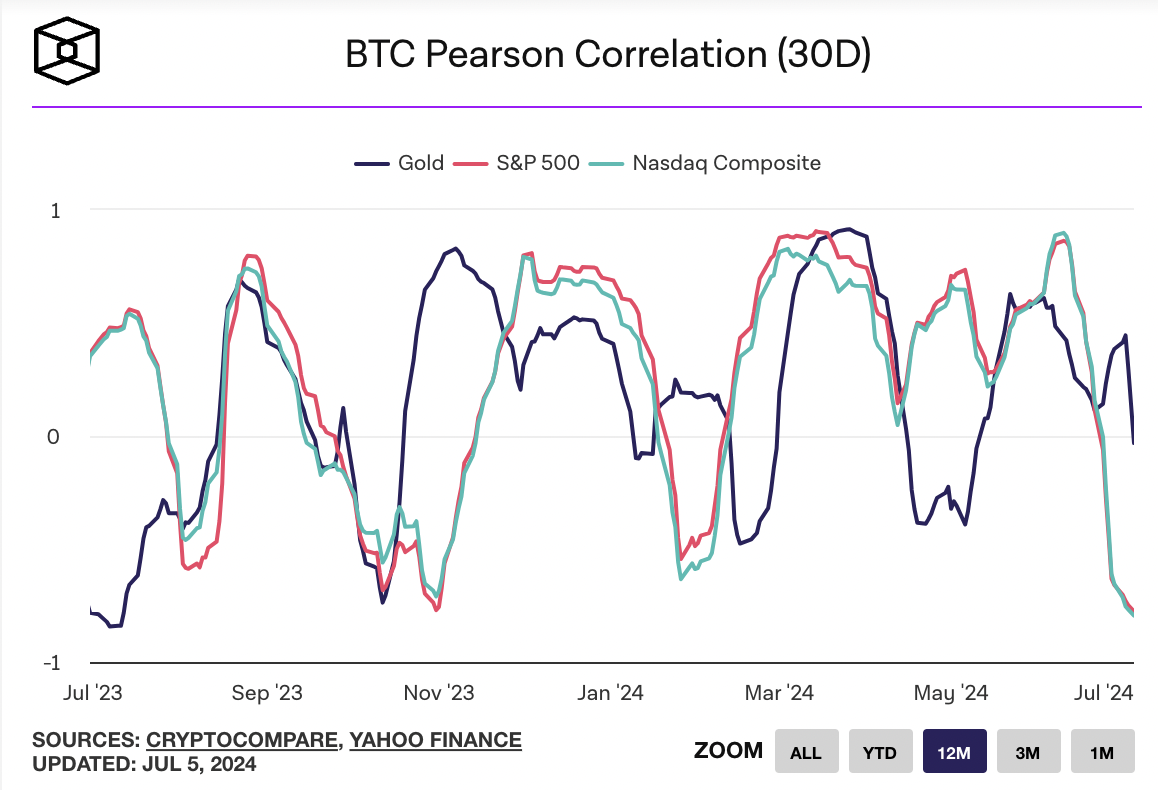
Stop me if you’ve heard this one before. Equities reached all-time highs again, Treasury yields fell, and crypto got hammered. The negative correlation between equities and crypto has never been so pronounced. The correlation between the Nasdaq and Bitcoin is now 80%.
Momentum traders dominate digital assets—they always have. When it rains, it pours, and it doesn’t stop until sentiment hits rock bottom and sellers run out of ammo.
Sentiment hitting rock bottom? Getting there. The crypto fear & greed index is now at an 18-month low.
As for sellers running out of ammo, that remains to be seen. But we’ve been here before. Galaxy pointed out in their weekly research note that
“BTC is down 25% from its all-time high and ETH is down 30% from its March cycle high, but historically speaking, large drawdowns of this magnitude have been remarkably frequent in prior bull runs.”
At the end of last year, we
opined that 2023 looked remarkably like the end of 2019 / early 2020, when Bitcoin broke out first, and then the rest of the market caught up. This left us to wonder if 2024 would look similar to the end of 2020 / early 2021. Six months into the year, 2024 does, in fact, look very similar to 2021.
From January 2021 to April 2021, digital assets markets went basically straight up. Different sectors led the way (DeFi, then Web 3, then gaming) until April 2021’s final gasp higher, with memecoins outperforming everything else. When memecoins rally, it’s usually a sign that markets are getting toppy. This led to a large decline:
- May 2021: The Bloomberg Galaxy Crypto Index fell -21%
- June 2021: The Bloomberg Galaxy Crypto Index fell -14%
- July 2021: The Bloomberg Galaxy Crypto Index fell -14% through July 20th…. But then…
- ...a 6-month rally followed, with July 2021 actually ending the month +8%, followed by August 2021 rising +29%.
Below is a graph of the total market capitalization from 2021, showing that the second-quarter dip was fully erased by the end of August, just six weeks later.
Source: TradingView
Those who were invested in Arca’s private funds may remember this excerpt from our July 2021 investor letter:
We constantly look for market parallels, and it’s hard not to see them right now. After a long 9-month rally beginning in the 3rd quarter of 2023, crypto has stalled, and when it stalls, it often leads to short-selling and doom posting. But when surveying the broader landscape, we see a lot of short-term headwinds related to increased supply pressures (Mt. Gox, U.S. and German government coins for sale, VC unlocks, new issuance) that aren’t being offset at all by the myriad of positive long-term demand drivers (ETH ETF about to be approved this week or next, an election skewing heavily towards crypto-friendly Republicans, and rate cuts on the horizon for the first time since 2020).
Imagine telling someone that the odds of an Ethereum ETF were basically 0% heading into May. Then, it miraculously was approved in the biggest “about-face” in U.S. crypto regulatory history, and less than six weeks later, ETH is trading 10% below where it was trading before this happened. Even someone who knew nothing about Ethereum or crypto would find this somewhat confusing, especially when the short-term supply pressures are related solely to Bitcoin.
The market is the market, and it is telling you that the bulls are wrong. But history suggests that they may still be right.
Equity investors not buying the crypto selloff
The 4th of July bloodbath in crypto didn’t faze equity investors, who saw right through the light holiday session selling. On the Friday after the holiday, Coinbase (COIN) and Bitcoin mining stocks (WGMI) barely moved lower despite a 10%+ decline in Bitcoin.
Despite BTC's poor price performance, all of the publicly traded miners that we tracked ended the week green, with IREN and WULF both hitting a new 52-week high. Over the last three months, BTC has been -17%, while the miners have been flat to +200%!
This is the biggest divergence on record between BTC and Bitcoin mining stocks. The floor value of all miners has risen due to AI data center valuation re-ratings and strong balance sheets (high floor). At the same time, the upside is still expected to be 3-5x Bitcoin’s price due to high operating leverage in their earnings relative to BTC price.
Miners have great upside/downside volatility right now, and equity investors have clearly turned their attention this way.
Source: TradingView