 What Happened This Week in the Digital Assets Markets?
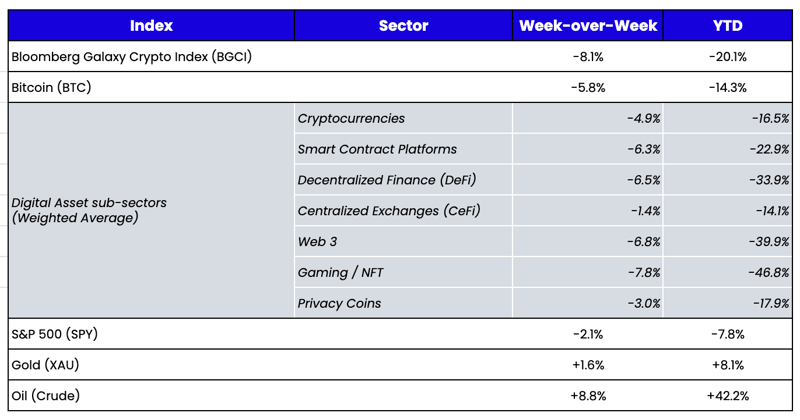
Week-over-Week Price Changes (as of Sunday, 4/17/22)
Source: TradingView, CNBC, Bloomberg, Messari
It’s getting very difficult to write a weekly blog about digital assets because, quite frankly, not much has happened in the past two months. The market continues to chop, with little overall growth or declines in the total market cap of digital assets. The biggest ongoing news story is the much anticipated Ethereum 2.0 merge, which is likely happening this year but the timetable is uncertain. Many, including ourselves, have written about the higher correlations with equities recently, especially to the Nasdaq, but even that is a boring topic because the Nasdaq itself hasn’t been that interesting (now unchanged since late January 2022 despite the volatility). Perhaps this week’s large earnings slate will turn attention away from the rates curve (and the Fed’s incompetency) and back towards fundamentals.
In corporate debt and equity markets, when markets become less liquid and boring, it usually forces shorts to cover as it becomes too expensive to fight a listless tape, and the consistent inflows from dividends and coupon payments are enough to buoy the market. In digital assets, however, a boring market is often viewed as a weak market, because if it’s not going up, it must be going down. Shorts are still expensive, but relative to the earnings potential, not a deal breaker. Bored traders in digital asset markets become impatient traders, which leads to a lot of pushing on a string.
In the meantime, we’ll try to dig a little deeper to offer some timeless value in lieu of timely analysis. Back in May 2021, when institutional investment began to really pick up in earnest, we were receiving a lot of questions about where and how we educate ourselves on digital assets. So we provided our readers and investors with a quick-and-dirty list of resources that we read daily to stay abreast of the market. This was a very helpful reference for newcomers. Today, questions are less about where to get info, and more about HOW we monitor the market on a day-to-day basis. So let’s try this again.
Some Simple Ways to Monitor Digital Assets Health
We look at several basic risk signals on a daily basis to help us determine the relative strength and health of the digital assets market. This is by no means a fully encompassing list, but it is a useful guide that shows what factors, we feel, drive bigger picture buying or selling. These are volatile signals, and often change on a dime, so we take each signal with a grain of salt. Further, asset selection and active management continue to massively outperform any passive index strategy, so this doesn’t necessarily mean we go all-in when risks are in our favor, or fully exit the market when they are not. But overall, it definitely paints a picture that helps our fund strategies with risk management.
- Bitcoin and Ethereum specific signals: The digital assets market has certainly moved beyond just Bitcoin and Ethereum (see our Digital Assets taxonomy for a better understanding), but some parts of the market are still best viewed via a BTC and ETH lense, especially as it pertains to miners and derivatives.
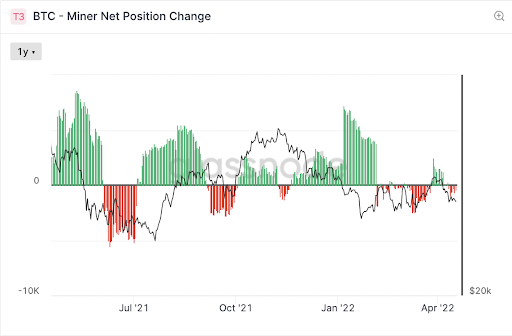
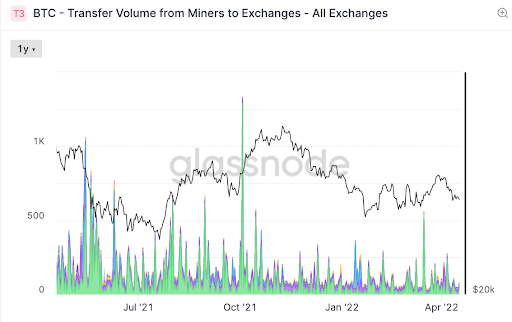
- Miner activity - Miners used to have a much larger impact on Bitcoin price than they do today as the investor base has grown and diversified, but it's still useful to see when miners are holding the BTC that they mine, versus when they are selling it immediately. Using Glassnode data, we can see everything from change in wallet balances to when/if miners are sending BTC directly to exchanges (presumably to sell). It is bullish when miners are accumulating and bearish when they are net sellers.
Source: Glassnode
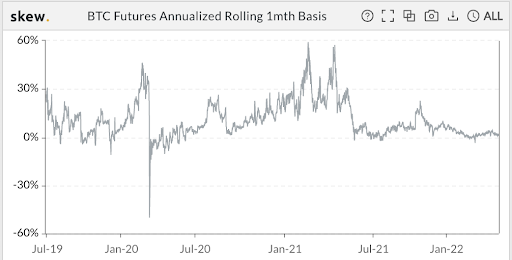
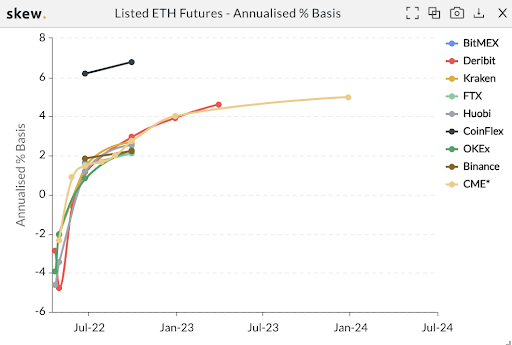
- The “Basis” (spot/futures arb) - Many digital assets now have robust futures markets, but the shape of the curve is still most pronounced when looking specifically at BTC and ETH. These curves vary across platforms, and are often very different when comparing the TradFi dominated CME vs retail-dominated Binance, but in general, the rate of change is most important. When curves are steep, or steepening, it often signals bullishness as market makers, traders, and investors snap up futures using leverage in lieu of buying spot, but when curves are too steep, it often signals a bearish setup as leverage can easily cause downside pressure and liquidations.
Source: Skew
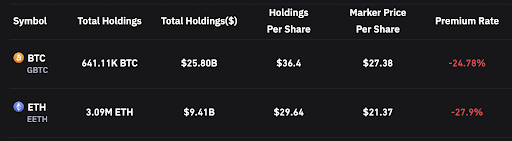
- Grayscale premiums/discounts - Another signal that is less relevant than it used to be, as Grayscale’s monopoly on the market has gone away due to cheaper ETP and ETF products, but the premium or discount to NAV of the Grayscale trusts can indicate retail participation. When there is a large premium, it means retail investors are heavy buyers, and when there is a massive discount, it can mean retail is not buying (though again, lately, it’s more indicative of cheaper, better alternatives).
- Put skew - BTC and ETH still dominate options trading, but can be used as a barometer of activity. When put skew is very positive (puts are more expensive than calls), it can mean that funds are hedging aggressively and/or traders are making bearish bets. When put skew is negative (calls are more expensive than puts), it typically means market makers are getting lifted aggressively by buyers and are using calls to flatten deltas.
Source: Skew
- Fear & Greed Index - Most investors are now quite aware of how sentiment swings digital assets, and how reflexive the market can be on both the upside and downside. The Fear & Greed Index helps identify when sentiment has swung too far in one direction. For example, sentiment is now in the gutter, and this has historically been a good time to be a contrarian. Conversely, when sentiment is high, the euphoria rarely lasts.
Macro signals
We’ve always monitored macro signals, but they are certainly more important now than historically due to the overwhelming influence from TradFi.
- The U.S. Dollar (DXY) - As a general rule, a rising USD is bad for risk assets, and lately that means digital assets too. The USD is now +12% since May 2021, and that has certainly weighed on digital assets.
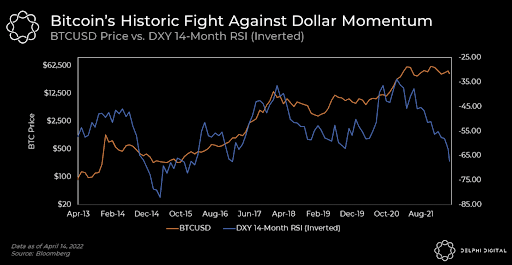 Source: Delphi Digital
- Coinbase/Robinhood rankings - Coinbase is currently the #16 most popular finance app in the Apple app store, and Robinhood is #18. Late last year, these two apps were #1 and #2. Given both are heavily dominated by retail trading, app rankings can provide a good indication of overall interest in digital assets. The Block has a great dashboard for monitoring these trends.
- Meme stocks/coins - This is an extension of the above, and while silly, the movements in assets like ARKK, GME, and AMC in the equity world, as well as assets like DOGE and SHIB in digital assets, can shed light into how retail investors are thinking about risky assets.
- Correlations to SPX/Gold - As a general rule, when correlations are low, investing is more profitable. Low correlations indicate alpha opportunities are abundant, and tend to lead to strong idiosyncratic returns in specific digital assets. When correlations are high versus equities and/or Gold, it tends to mean that trading is being dominated by factors outside of digital assets.

Broader digital asset signals
While there are more tools available today to monitor BTC, ETH, and macro indicators, the data available for other assets continues to grow and develop.
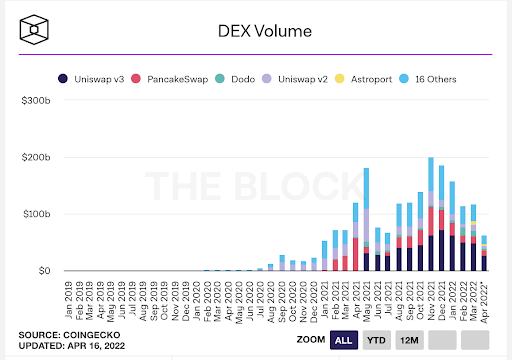
- Exchange volume - Like all markets, when volumes are higher, spreads are tighter, liquidity is deeper, and markets tend to be more bullish. In digital assets, we monitor centralized exchanges, decentralized exchanges, and look at both spot and derivatives markets.
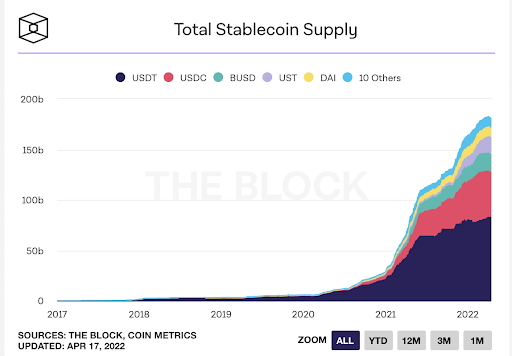
Stablecoin supply - Probably the most important indicator, U.S. dollar stablecoins are the equivalent of cash in the market. Even more important, this cash is trapped (as it would be converted back into U.S. dollars and sent to banks if investors wanted to exit the market altogether), whereas they leave it in stablecoins on exchanges if they want to invest again in the future. As this cash builds up, it is an undeniable bullish signal and provides a floor to the market. Further, the Stablecoin Supply Ratio (SSR) shows the percentage of digital assets relative to stablecoins—when this number is low it shows that the size of the potential buying power is high relative to the assets that can be bought.
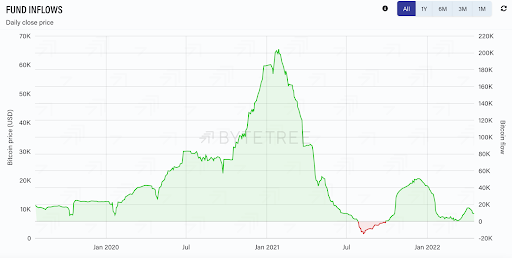
Fund flows - similar to traditional markets, fund flows dominate digital assets as well. This is harder to track, as most investment dollars flow into private funds rather than ETFs and ETPs, but it is still a healthy barometer of where investment dollars are flowing. Coinshares releases a great weekly report showing inflows and outflows, but you can also monitor these flows daily.
- Funding rates - The perpetual futures contract is not unique to digital assets, but it has certainly become most popular in digital assets trading. The funding rate is what keeps a contract with no stated maturity in balance, becoming negative (shorts paying longs) when the market needs to attract buyers, and positive (longs paying shorts) when the market needs to attract sellers. In general, a negative funding rate means there will be support in the market, but it is the rate of change that is most indicative of market direction in the near-term.
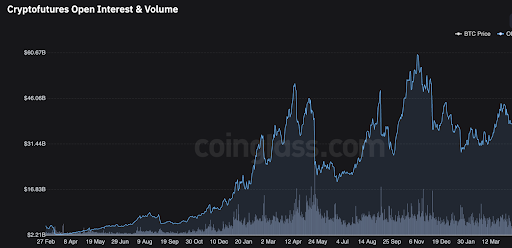
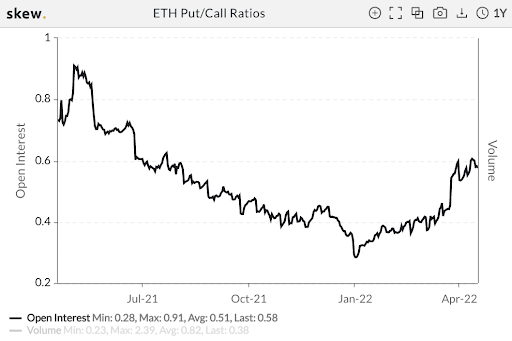
- Leverage - The open interest in perpetual futures contracts, as well as in the options market, shows the relative bullishness of the market. Like funding rates, these are volatile numbers, but high leverage can be indicative of upcoming cascading liquidations. Again, the rate of change matters more than the absolute values.
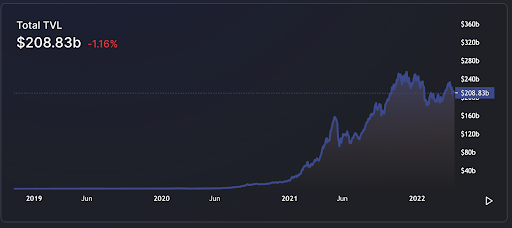
- DeFi/TVL - DeFi is still the most used application within digital assets, and as TVL (deposits) grows, so does the overall market. High levels of DeFi activity are similar to high levels of banking activity, which is typical during periods of economic growth.
- Intra-asset correlations - While the market tends to focus mostly on BTC versus equities, it’s far more important to monitor different sectors within digital assets against each other. It’s not uncommon for half the market to be up, and half the market to be down on typical trading days even if the top 10-20 digital assets by market cap (which are all either currencies or layer 1 protocols) all move together. We use internal indicators here rather than publicly available apps, but it is generally more bullish when the different assets move up and down for different reasons, rather than “student body left / student body right” broad-based moves higher or lower
- Regulatory regime – Another one that is more subjective than objective. We all know regulation is inevitable in the United States, but we can learn a lot regarding the path to get there from Goldman Gary Gensler’s jawboning and political ambitions, to the far more balanced and well-educated SEC staff that is constantly working with funds and service providers to find the best solutions. As government officials toggle from hard line to constructive, markets tend to move.
One of the best parts about digital assets is that anyone who can read a block explorer or program an API pull can get access to seemingly unlimited data. The monitoring and interpretation of this data can help create a top-down overview overlaying bottoms-up analysis.
What We’re Reading This Week


 Source: Coinglass
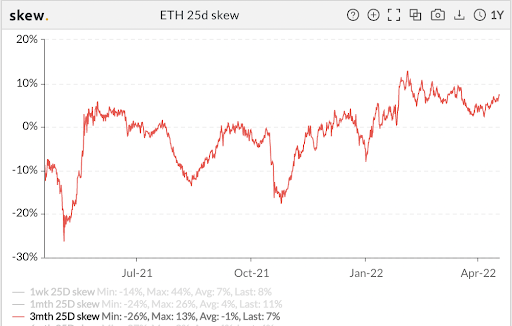
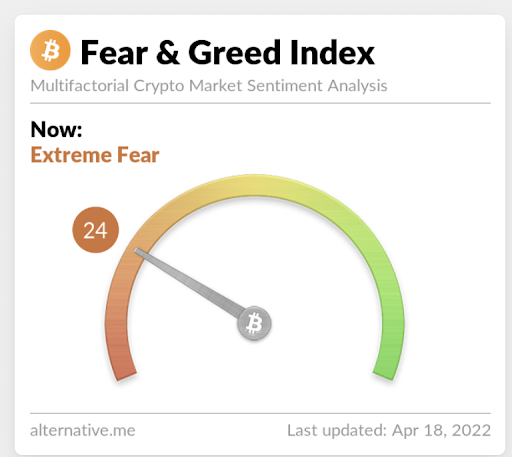
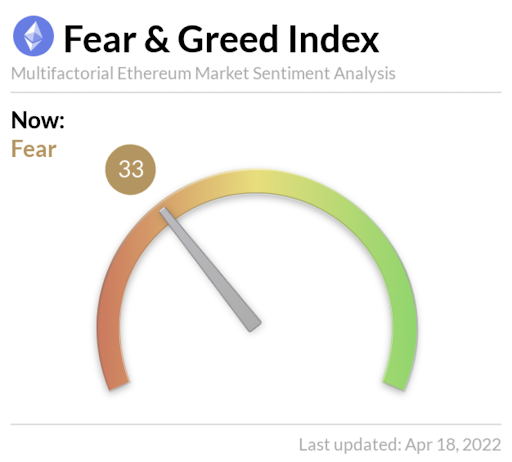
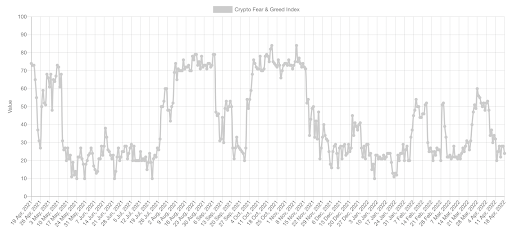 Source: Alternative
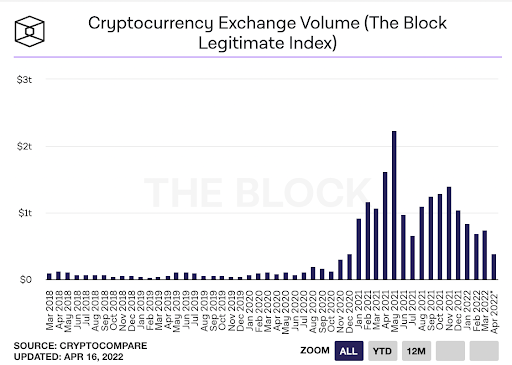

 Source: DefiLlama